
QUINT / OBSERVATIONAL CASE STUDY
A four-week Q.FACE experience.
Follow one participant’s three-session routine, with facial photographs and exploratory image analysis at week four.
Explore the findings- Participant
- 32-year-old female
- Recorded course
- 3 weekly sessions
- Follow-up
- Four weeks after start
- Evidence
- One observational case
01 / WHAT WAS OBSERVED
A closer look at texture.
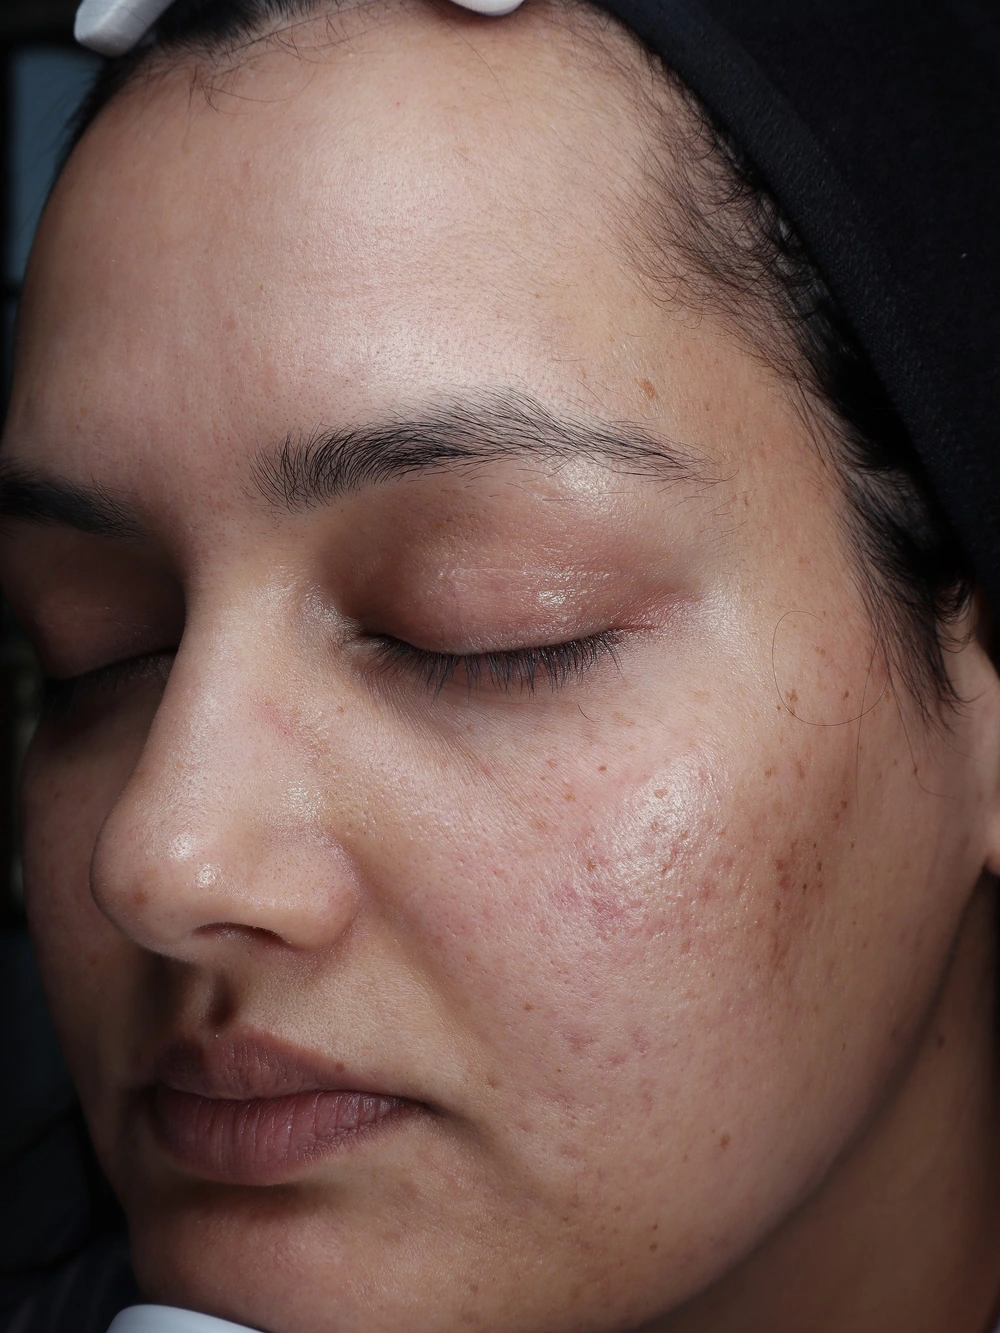
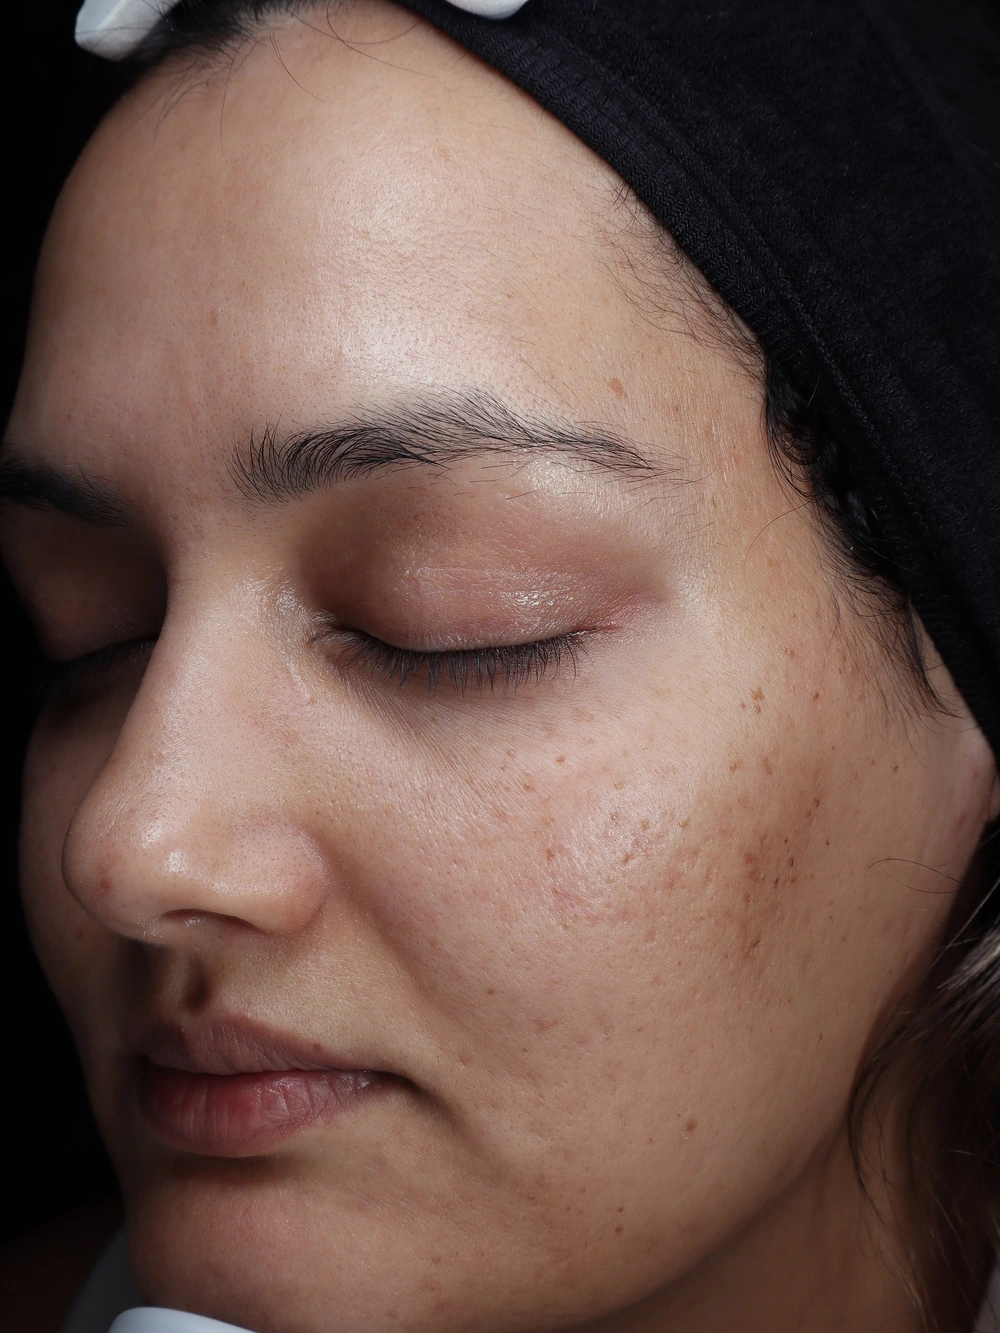
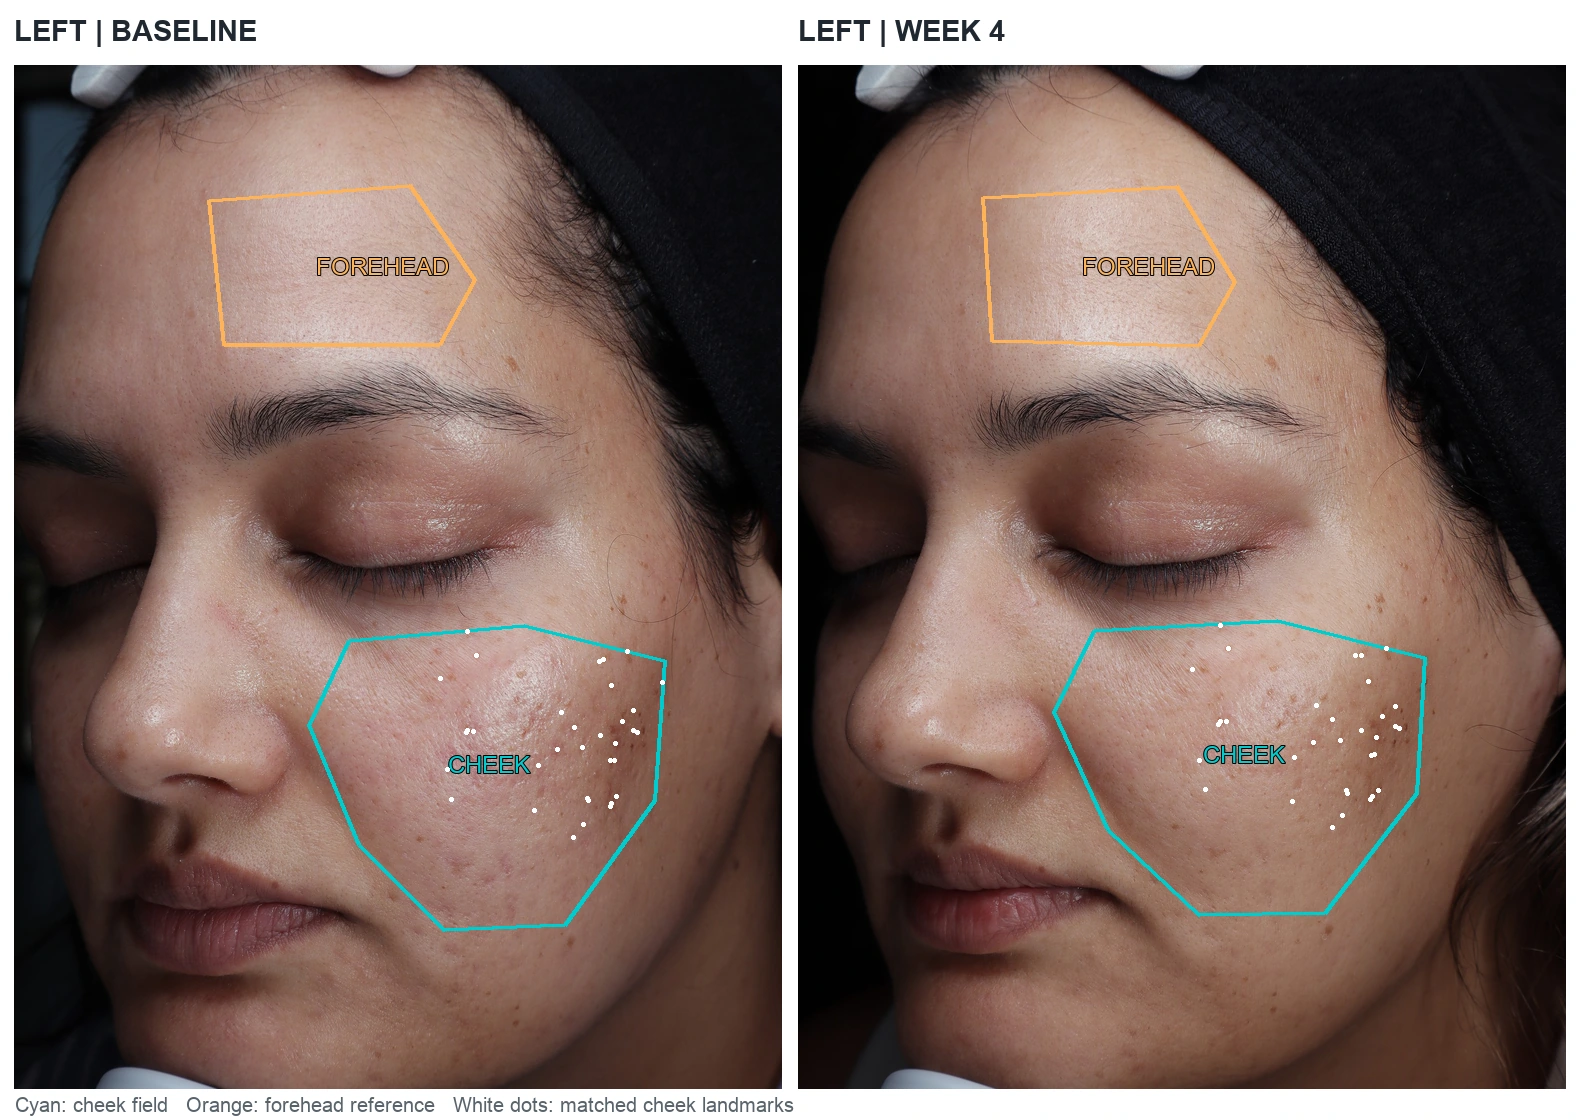
Selected cheek photographs showed lower fine texture contrast at week four. Pores, brown marks and residual texture remained visible.
02 / THE RECORDED ROUTINE
Three sessions. Four weeks.
One Q.FACE session each week for three weeks, with follow-up photography four weeks after the start.
- WEEK 0
First session
Baseline and first Q.FACE session on August 18, 2026.
- WEEK 1
Second session
The next weekly session, approximately August 25.
- WEEK 2
Third session
The final session, approximately September 1.
- WEEK 4
Photographic follow-up
Left and right facial views, approximately September 15.
August 18 is the confirmed start date. Later dates are calculated from the reported intervals. View the Q.FACE instructions.
03 / EXPLORATORY IMAGE ANALYSIS
Behind the numbers.
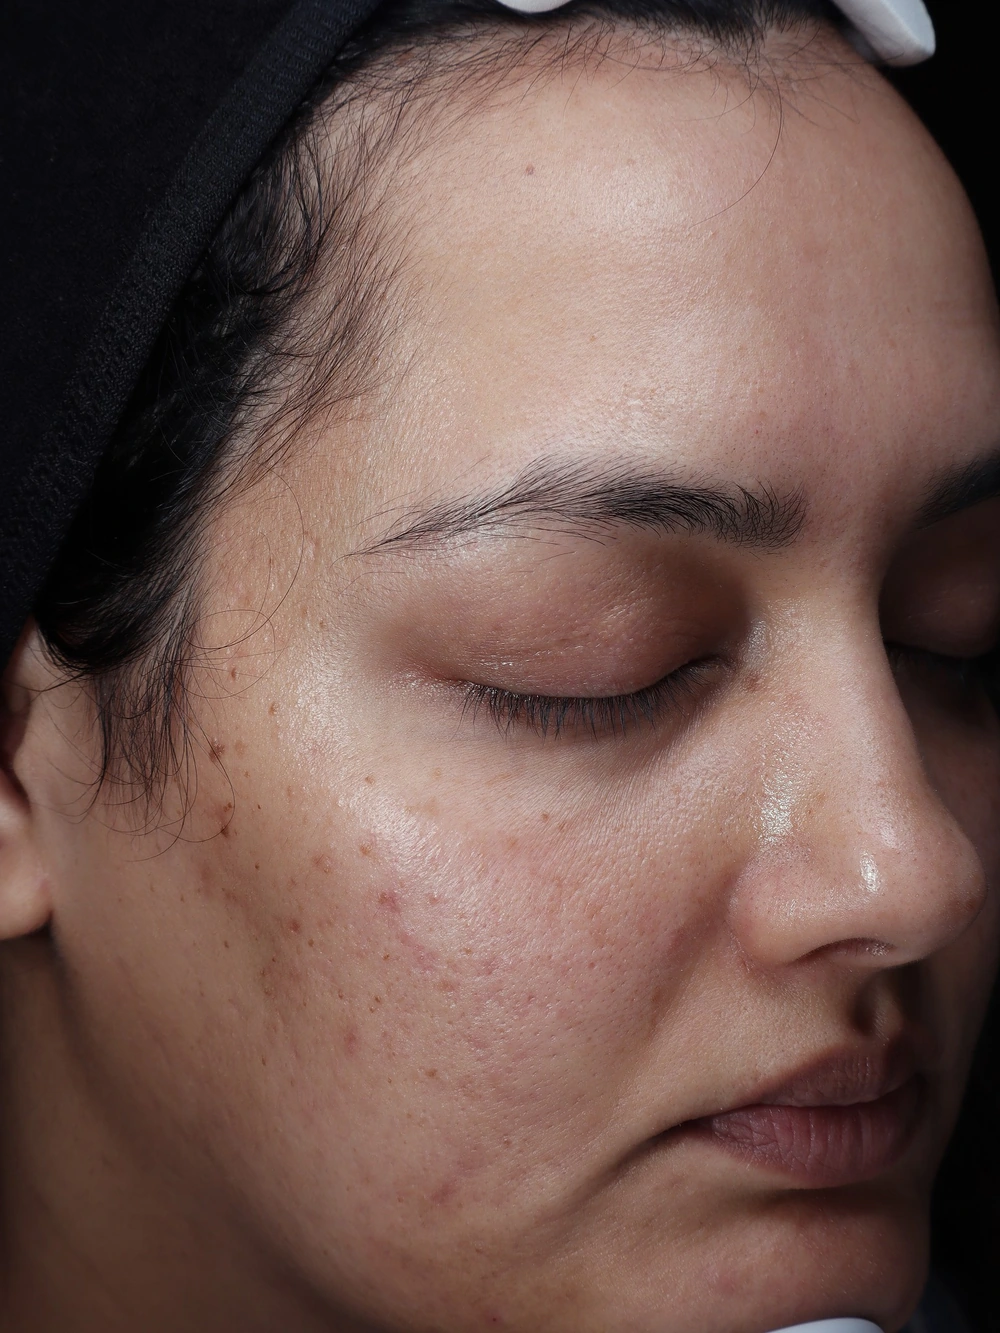
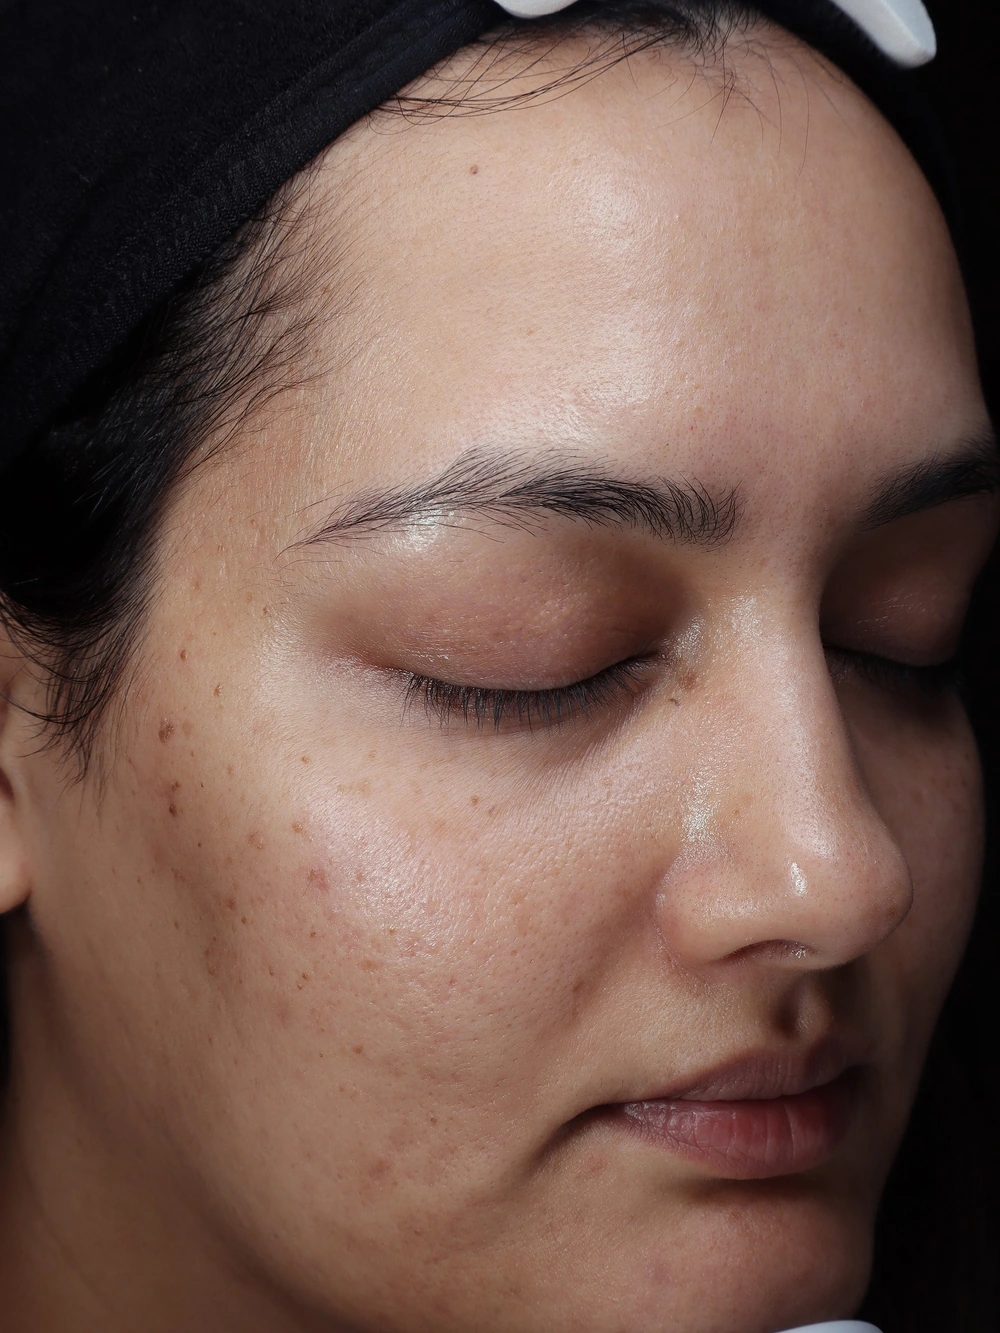
Both cheek measurements remained lower when the selected fields and alignment methods were varied. The color findings were less consistent.
Methods and analysis
LEFT CHEEK / PHOTOGRAPHIC MEASUREMENT
14.8% lower
Fine texture contrast
The image contrast index changed from 1.799 at baseline to 1.533 at week four in the selected left cheek field.
RIGHT CHEEK / PHOTOGRAPHIC MEASUREMENT
14.0% lower
Fine texture contrast
The image contrast index changed from 1.689 to 1.452 in the selected right cheek field.
Fine texture contrast describes how strongly small light-dark details stand out in a photograph. These percentages do not measure physical skin smoothness, pore size, scar depth or collagen change.
Texture measurements and sensitivity checks
The analysis measured fine image contrast in anatomically matched cheek fields using the original, unwarped image pixels. Each cheek was checked under 30 combinations of field size, position and alignment model.
| Cheek | Baseline | Week 4 | Change | Sensitivity range |
|---|---|---|---|---|
| Left | 1.799 | 1.533 | 14.8% lower | 12.2–17.7% lower |
| Right | 1.689 | 1.452 | 14.0% lower | 11.9–15.5% lower |
Sensitivity ranges describe variation across analysis choices; they are not confidence intervals. The right forehead also showed 6.6% lower texture contrast. Relative to that reference, the right cheek/forehead ratio was 7.9% lower; the left ratio was 14.7% lower. The forehead is not an untreated control.
Color changes and why they need context
Both cheeks shifted modestly away from red on the CIELAB a* color axis, but the forehead also shifted. After subtracting that shared shift, the differences were only −0.40 units on the left and −0.18 on the right. These images do not support one reliable percentage of clinical redness reduction.
| Measure / cheek | Baseline | Week 4 | Change |
|---|---|---|---|
| a* color axis / left | 13.32 | 12.43 | −0.90 units |
| a* color axis / right | 13.20 | 12.28 | −0.92 units |
| Red-green index / left | 13.24 | 13.08 | 1.2% lower |
| Red-green index / right | 13.20 | 12.70 | 3.8% lower |
| Above red-pixel threshold / left | 24.92% | 21.96% | −2.95 percentage points |
| Above red-pixel threshold / right | 24.99% | 21.25% | −3.74 percentage points |
Each red-pixel threshold was fixed at its baseline 75th percentile. This measures image area, not lesions or inflammation. Brown marks, light and shine can affect the classification.
How the photographs were aligned and measured
Original 1536 × 2048 JPEGs were extracted from the left and right VISIA reports. Matched local image features guided the cheek-region boundaries; measurements used native pixels without warping the photographs. The enlarged right-side report supplied visual context rather than a separate measurement.
The texture index summarizes differences between two Gaussian-smoothed versions of log image luminance at 2- and 8-pixel scales. It includes texture, marks and highlights. Color conversion assumed sRGB because no embedded color profile was available. Complete formulas, alignment residuals and checks are in the report.
What this case can tell us.
The selected cheek photographs show a repeatable reduction in fine texture contrast, with modest, less consistent color changes.
Single-participant observations. These photographs do not establish that QUINT caused the changes or predict typical results.
What remains uncertain.
- One participant, with no untreated control or blinded clinical assessment.
- Head position, focus, lighting and skin shine can affect image measurements. No color calibration target, physical scale or independent repeat captures were available.
- The analysis does not establish structural skin repair or a reliable clinical redness percentage.
THE COMPLETE RECORD
Read the full case study.
The supplied report, including methods, figures and limitations.
8-page report · PDF